Product
See how guests use your menu
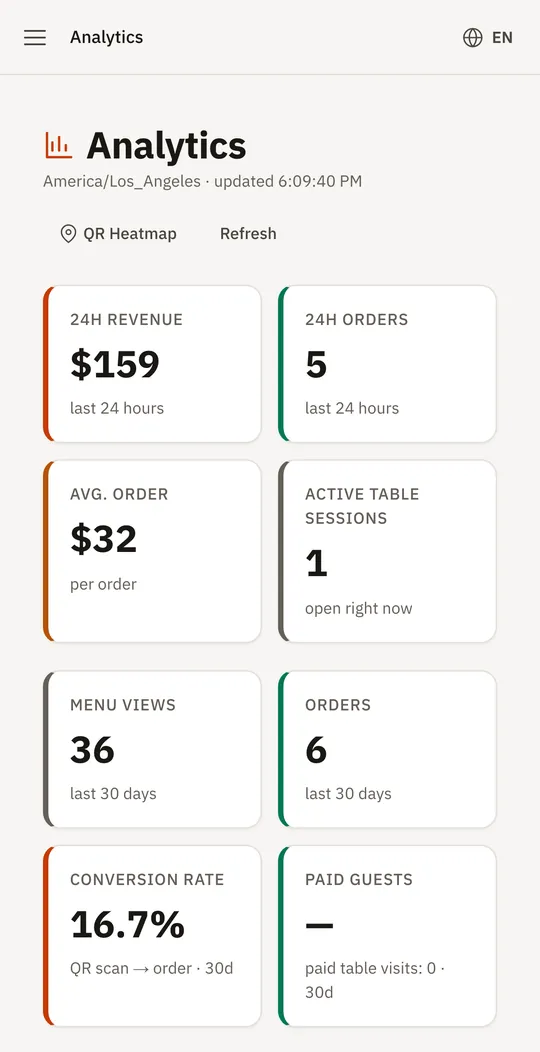
Restaurant analytics turn menu activity into decisions. Thmenu counts the scans of each code, the items guests open and — when you take orders through the menu — orders, revenue, average order value and best sellers, so you can see what sells, when you are busy and which items people look at but do not order.
Cafés and restaurants read the same reports: when the menu is busy, which items guests open and, with ordering on, what sells.
From scan to sale
Scans
How many times the menu was opened, by day and by hour, by table and by room.
Item views
Which items guests open most.
Orders and revenue
Orders, revenue and average order value over time, and how many scans turn into orders.
Reports in the panel
- 01
Best sellers and categories
Top products by revenue and the share of each category.
- 02
Busy hours
A day-by-hour heatmap shows when guests order.
- 03
Menu engineering
An ABC analysis ranks items by their contribution to sales.
- 04
Order funnel and live view
Where orders are in the kitchen flow right now, and a weekly view of returning activity.
Good to know
- Sales figures need orders
- Revenue and best sellers come from orders placed through Thmenu. A view-only menu still gets scan and item-view numbers.
- Per-table numbers are scans
- Today the table view counts scans per table; it is not a per-table revenue report.
Questions and answers
- What can I see if I do not take orders through Thmenu?
- Scans of each code by day, hour and table, and the items guests open. Revenue and best sellers need orders placed through Thmenu.
- Can I see which dishes people look at but do not order?
- Yes. Item views show which dishes guests open, and the sales reports show which ones sell, so you can compare the two.
- When are my busiest hours?
- A day-by-hour heatmap shows when guests order, and scan counts by hour show when they open the menu.
Restaurant analytics